| Param | Original file | Final file |
|---|---|---|
| Filename | modeM0/AS1A13_003T01_9000005902_43722cztM0_level2.fits | modeM0/AS1A13_003T01_9000005902_43722cztM0_level2_quad_clean.evt |
| Size (bytes) | 692,153,280 | 100,488,960 |
| Size | 660.1 MB | 95.8 MB |
| Events in quadrant A | 5,791,045 | 731,275 |
| Events in quadrant B | 4,258,987 | 753,485 |
| Events in quadrant C | 9,717,195 | 470,539 |
| Events in quadrant D | 5,353,824 | 637,244 |
| Mode SS | |||
|---|---|---|---|
| Quadrant | BADHDUFLAG | Total packets | Discarded packets |
| A | 0 | 130 | 0 |
| B | 0 | 130 | 0 |
| C | 0 | 130 | 0 |
| D | 0 | 130 | 0 |
| Mode M0 | |||
|---|---|---|---|
| Quadrant | BADHDUFLAG | Total packets | Discarded packets |
| A | 0 | 21851 | 1 |
| B | 0 | 17009 | 1 |
| C | 0 | 33280 | 1 |
| D | 0 | 20271 | 2 |
| Mode M9 | |||
|---|---|---|---|
| Quadrant | BADHDUFLAG | Total packets | Discarded packets |
| A | 0 | 10 | 0 |
| B | 0 | 10 | 0 |
| C | 0 | 10 | 0 |
| D | 0 | 10 | 0 |
| Quadrant | Total seconds | Saturated seconds | Saturation percentage |
|---|---|---|---|
| A | 6457 | 311 | 4.816478% |
| B | 6458 | 355 | 5.497058% |
| C | 6458 | 2637 | 40.833075% |
| D | 6457 | 493 | 7.635125% |
Noise dominated data is calculated using 1-second bins in cleaned event files. If a bin has >2000 counts, and if more than 50% of those come from <1% of pixels, then it is considered to be noise-dominated and hence unusable.
| Quadrant | # 1 sec bins | Bins with >0 counts | Bins with >2000 counts | High rate bins dominated by noise | Noise dominated (total time) | Noise dominated (detector-on time) | Marked lightcurve |
|---|---|---|---|---|---|---|---|
| A | 7447 | 6459 | 88 | 88 | 1.18% | 1.36% | 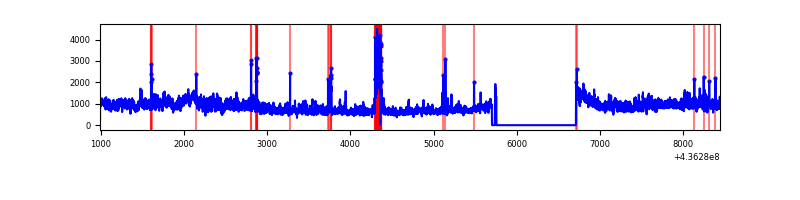 |
| B | 7448 | 6460 | 154 | 154 | 2.07% | 2.38% | 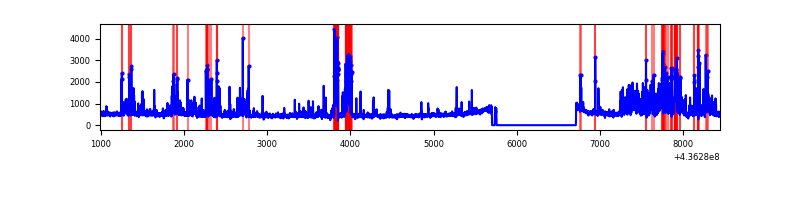 |
| C | 7448 | 6460 | 2120 | 2120 | 28.46% | 32.82% | 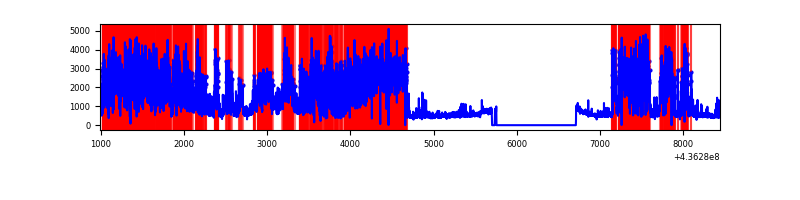 |
| D | 7447 | 6459 | 339 | 339 | 4.55% | 5.25% | 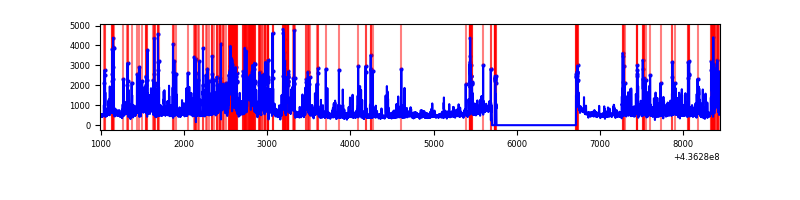 |
Top three noisy pixels from each quadrant. If the there are fewer than three noisy pixels in the level2.evt file, extra rows are filled as -1
| Pixel properties | Quadrant properties | ||||||
|---|---|---|---|---|---|---|---|
| Quadrant | DetID | PixID | Counts | Sigma | Mean | Median | Sigma |
| A | 15 | 222 | 1260829 | 8096.05 | 760 | 746 | 155.6 |
| A | 10 | 83 | 803397 | 5157.04 | 760 | 746 | 155.6 |
| A | 14 | 63 | 383542 | 2459.47 | 760 | 746 | 155.6 |
| B | 5 | 235 | 565135 | 3815.25 | 754 | 731 | 147.9 |
| B | 4 | 171 | 407286 | 2748.23 | 754 | 731 | 147.9 |
| B | 0 | 199 | 176624 | 1189.0 | 754 | 731 | 147.9 |
| C | 15 | 157 | 4489772 | 31711.25 | 602 | 604 | 141.6 |
| C | 15 | 174 | 1860244 | 13136.4 | 602 | 604 | 141.6 |
| C | 3 | 233 | 670392 | 4731.35 | 602 | 604 | 141.6 |
| D | 5 | 235 | 624780 | 3334.86 | 735 | 714 | 187.1 |
| D | 13 | 171 | 624379 | 3332.71 | 735 | 714 | 187.1 |
| D | 1 | 52 | 176724 | 940.55 | 735 | 714 | 187.1 |
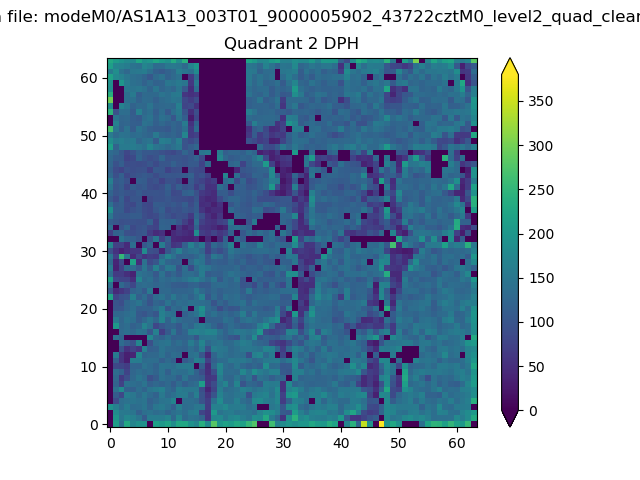
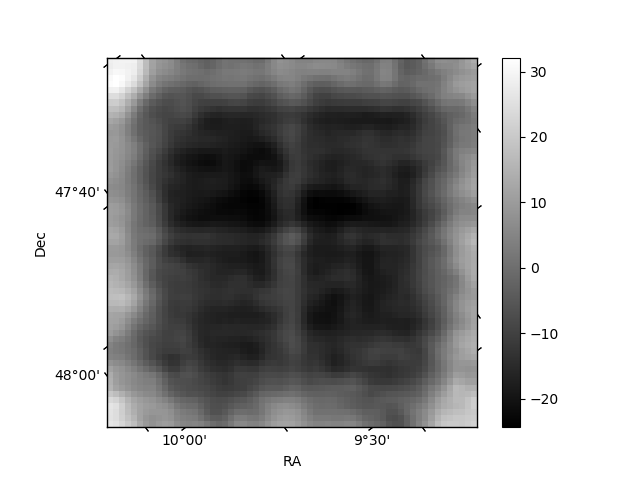
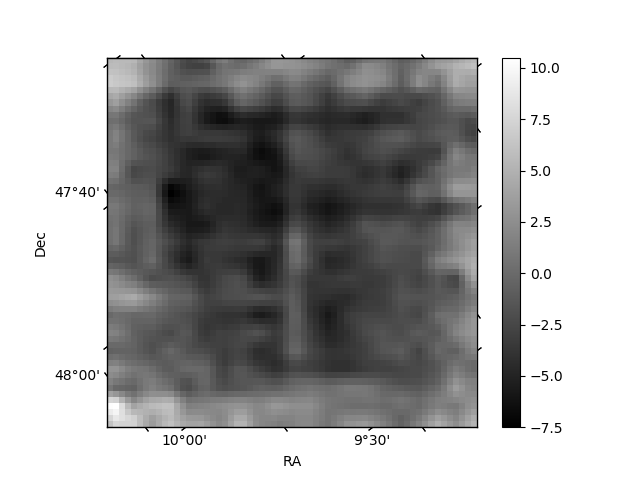
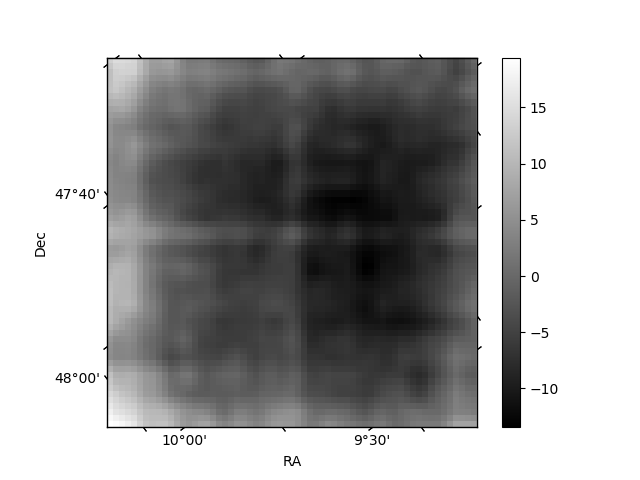
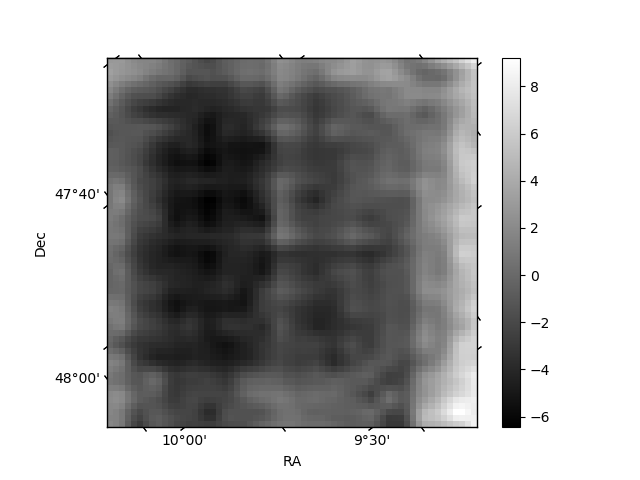
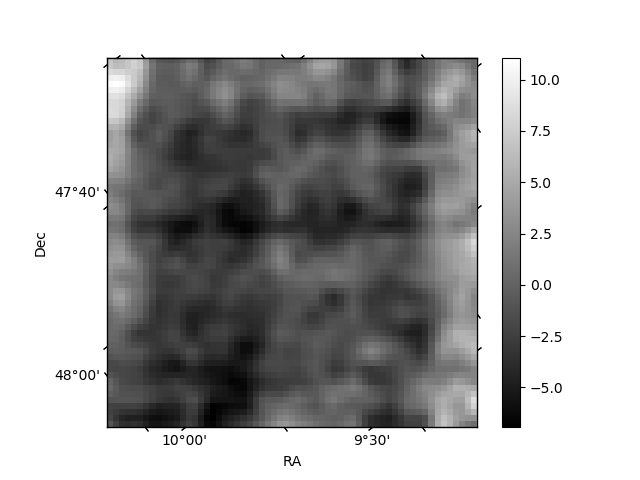
Histogram calculated using DETX and DETY for each event in the final _common_clean file
| Quadrant A | 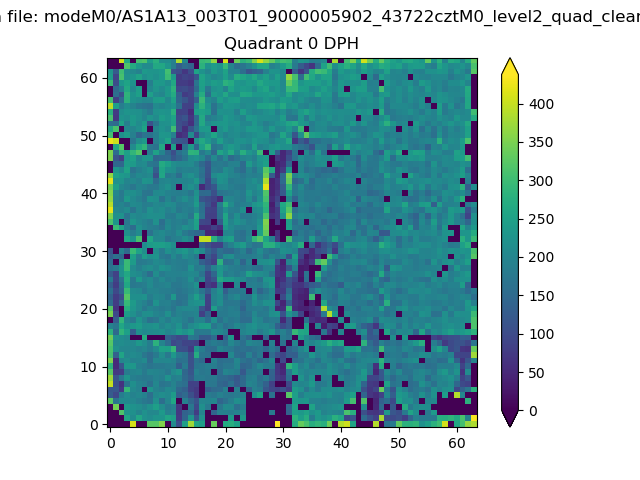 |
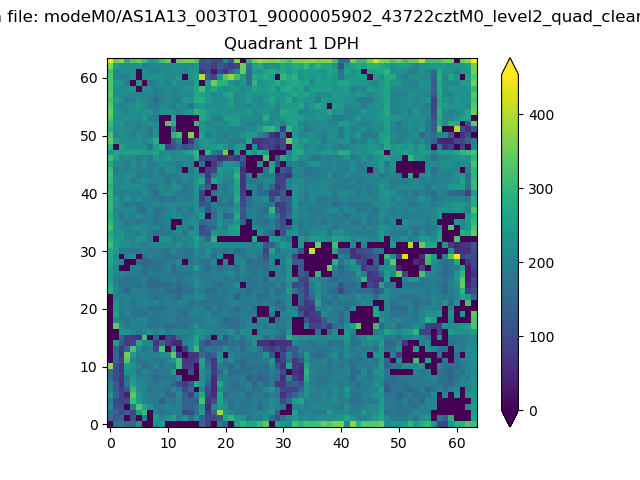 |
Quadrant B |
|---|---|---|---|
| Quadrant D | 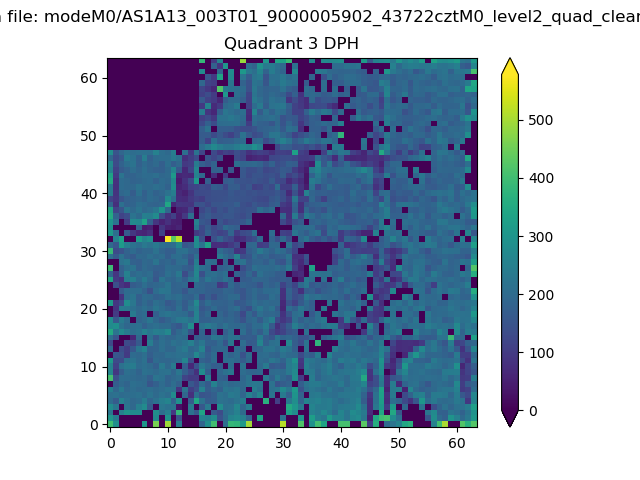 |
 |
Quadrant C |
| Plot type | Count rate plots | Images |
|---|---|---|
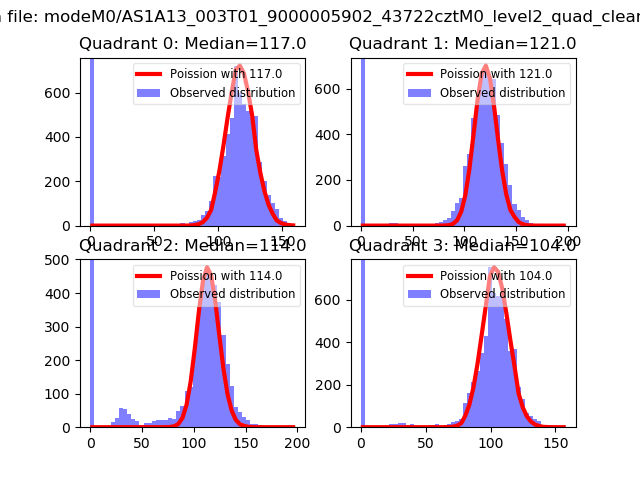
| Comparison with Poisson distribution Blue bars denote a histogram of data divided into 1 sec bins. Red curve is a Poisson curve with rate = median count rate of data. |
 |
 |
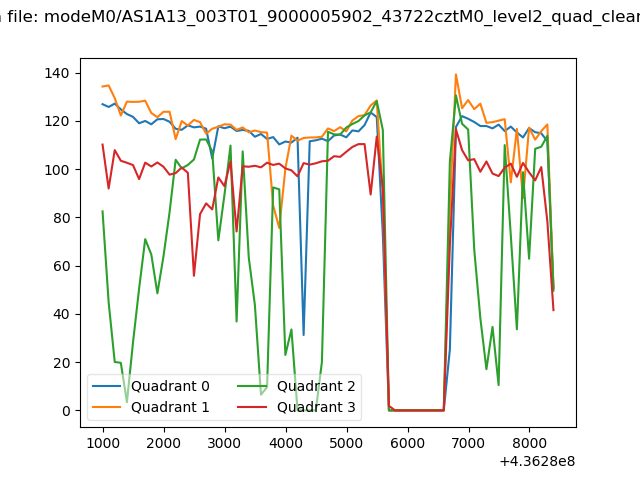
| Quadrant-wise count rates Data is divided into 100 sec bins |
 |
|
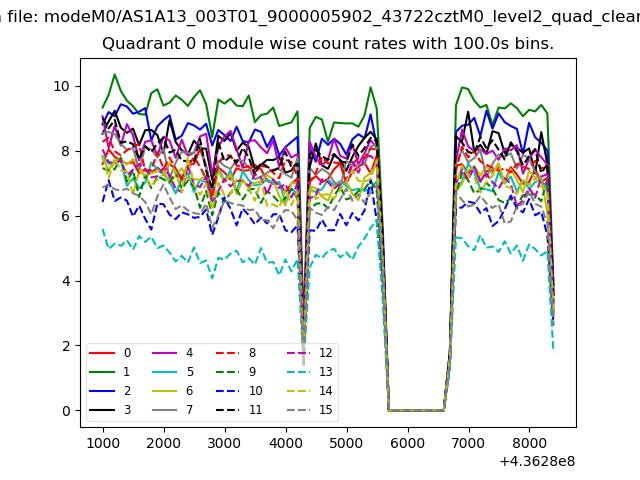
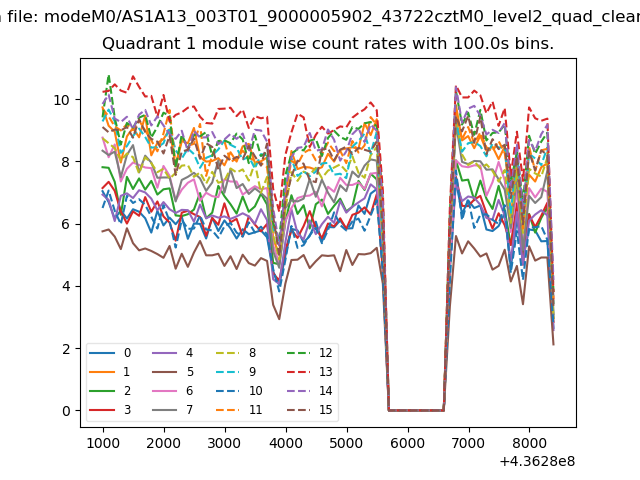
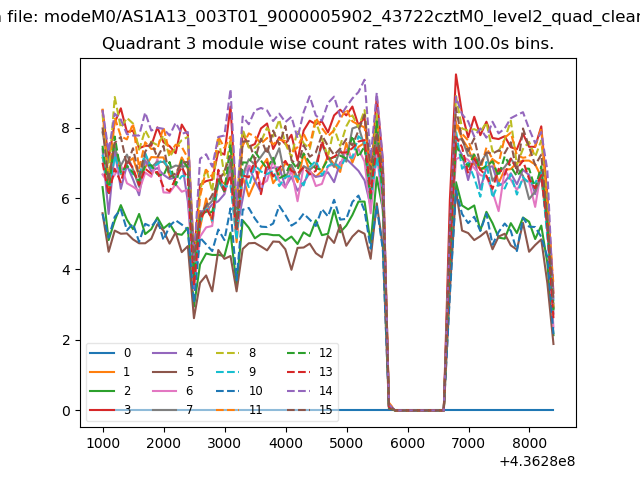
| Module-wise count rates for Quadrant A Data is divided into 100 sec bins |
 |
 |
| Module-wise count rates for Quadrant B Data is divided into 100 sec bins |
 |
 |
| Module-wise count rates for Quadrant C Data is divided into 100 sec bins |
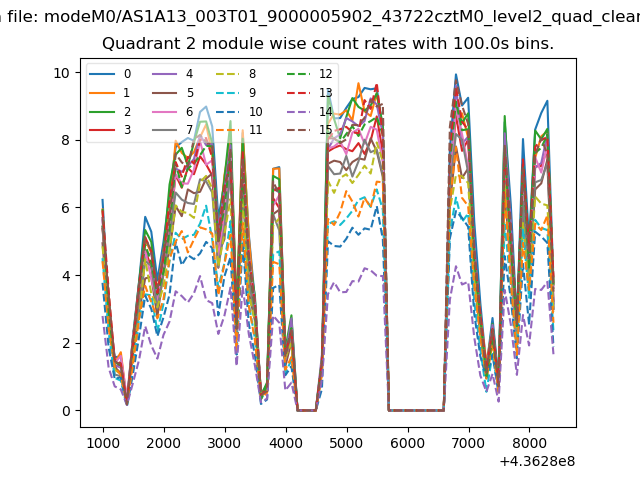 |
 |
| Module-wise count rates for Quadrant D Data is divided into 100 sec bins |
 |
 |
| Parameter | Plot |
|---|---|
| CZT HV Monitor | 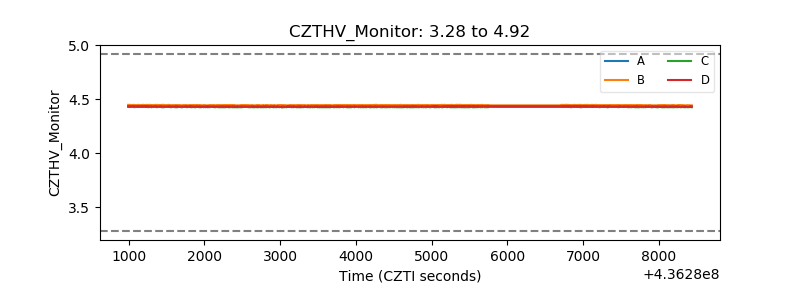 |
| D_VDD | 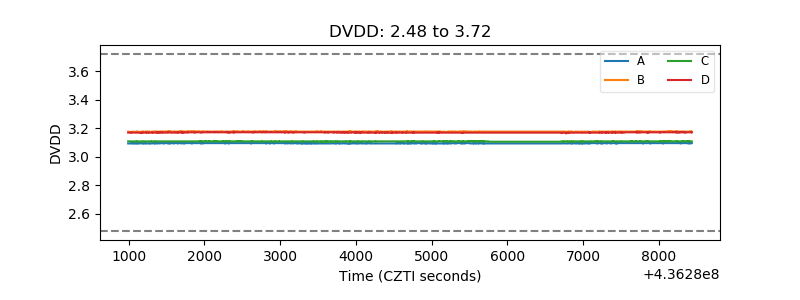 |
| Temperature 1 | 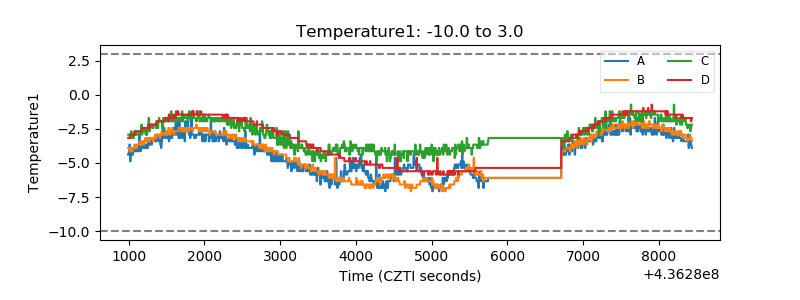 |
| Veto HV Monitor | 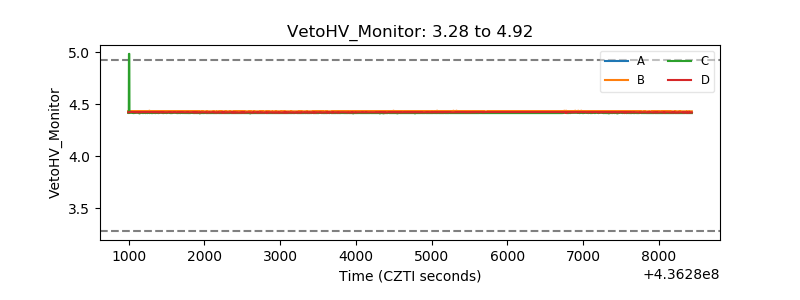 |
| Veto LLD | 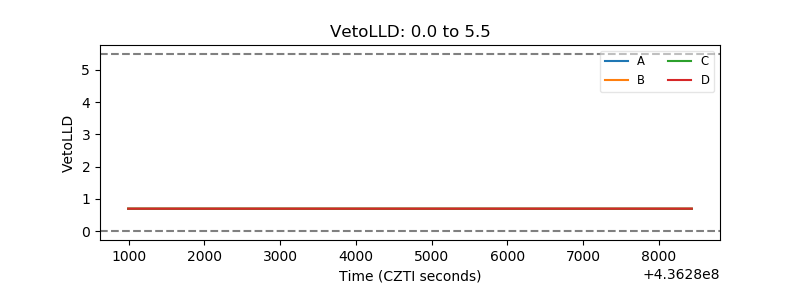 |
| Alpha Counter | 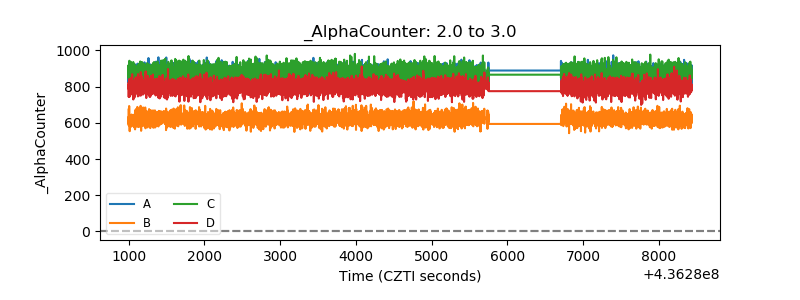 |
| _CPM_Rate | 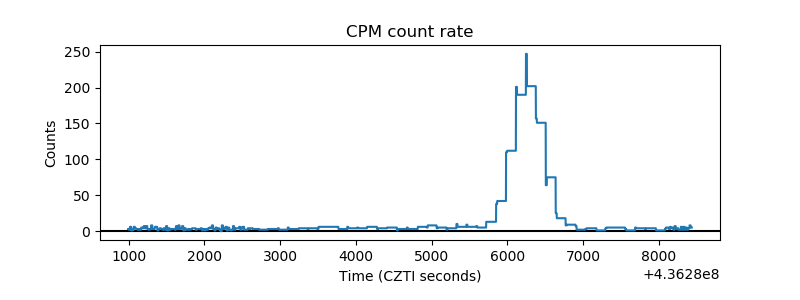 |
| CZT Counter | 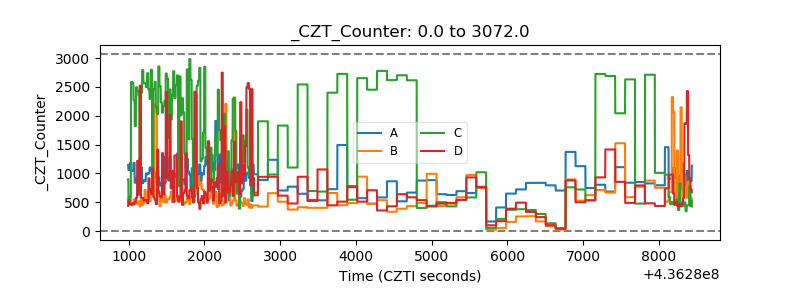 |
| +2.5 Volts monitor |  |
| +5 Volts monitor | 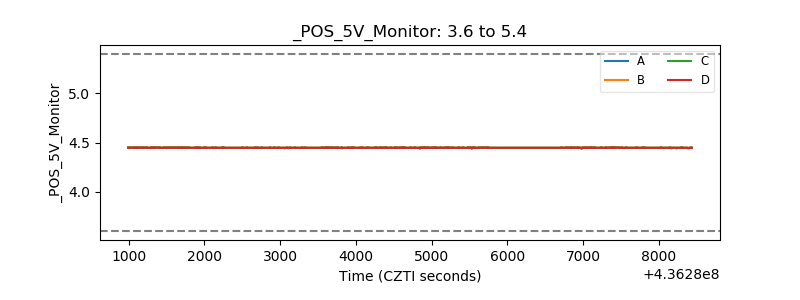 |
| _ROLL_ROT | 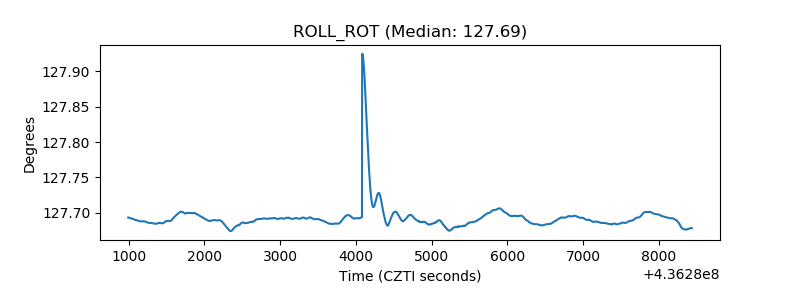 |
| _Roll_DEC | 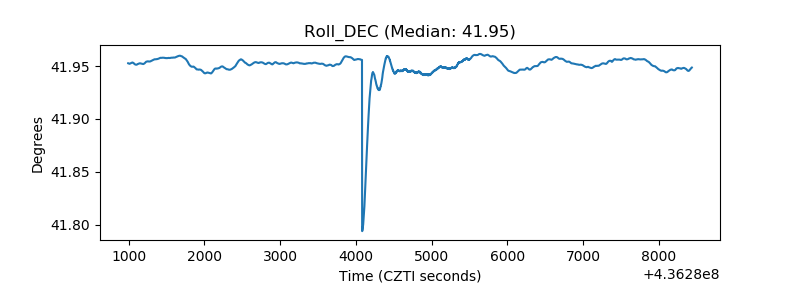 |
| _Roll_RA | 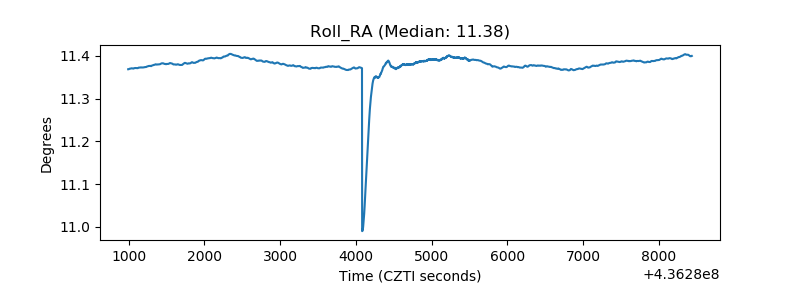 |
| Veto Counter | 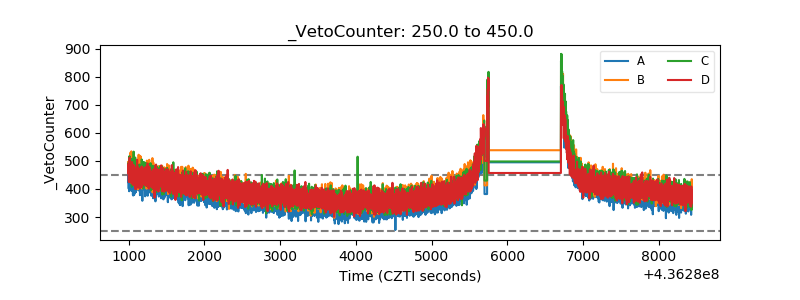 |